










In this article you’ll learn about…
- What the new Sales Dashboard is and why it is useful
- The key sales numbers you can see at a glance
- How to compare sales with previous periods
- How to understand where your revenue comes from
- How to drill down into the performance of one store
- Where to find the Sales Dashboard in YUMBI Reports
One dashboard, one clear view
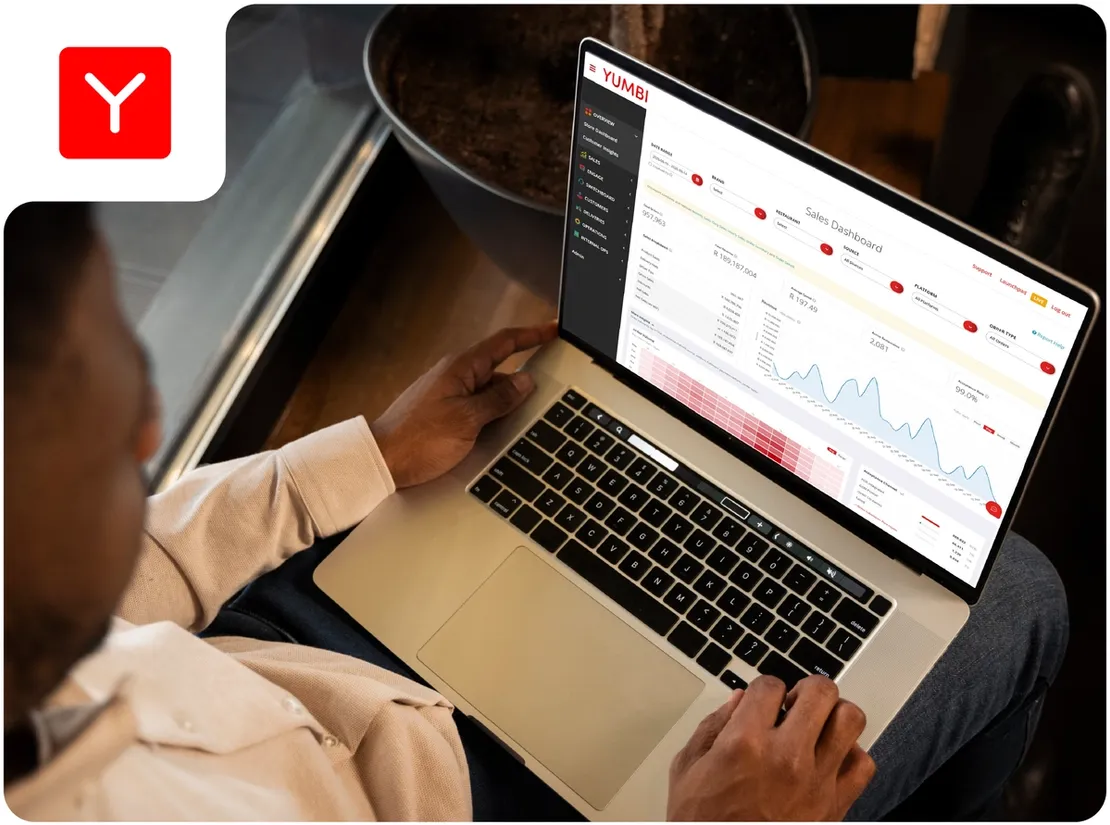
Keeping track of sales can mean jumping between different reports and trying to piece the numbers together. But now your YUMBI Sales Dashboard has had a great facelift, making it so much easier by bringing the information you need together in one place.
Whether you are part of a Brand team looking at the bigger picture or a franchisee checking your own QSR stats, you get a clear view of sales across YUMBI and channels such as Uber Eats, Mr D and Yango.
See your key numbers at a glance
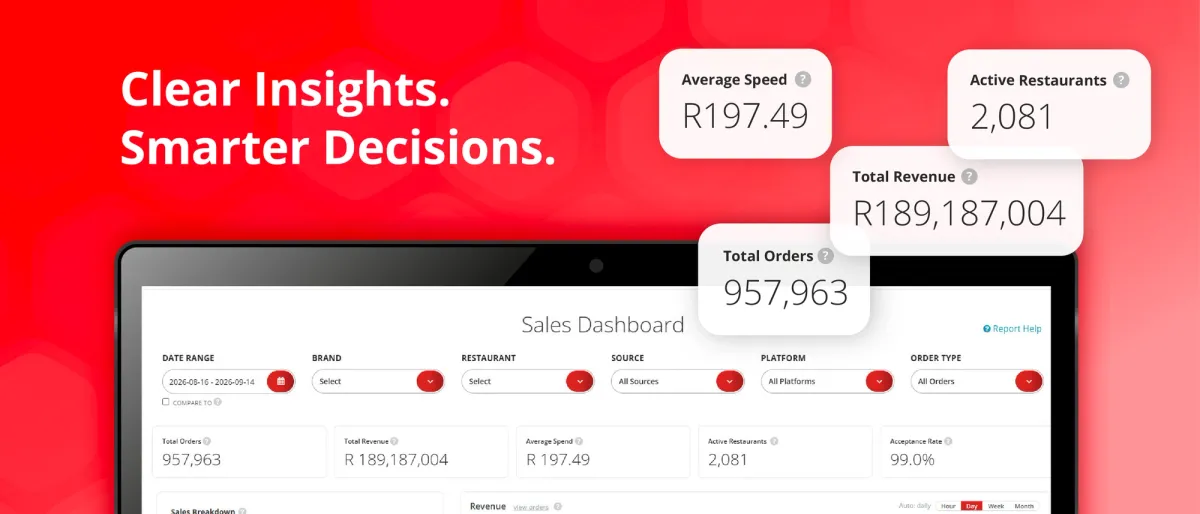
When you open the dashboard, the most important numbers are right in front of you: Total Orders, Total Revenue, Average Spend, Active Restaurants and Acceptance Rate.
There is no need to search through different reports. You can quickly see how your business is performing and spot anything that needs attention.
Compare your performance over time
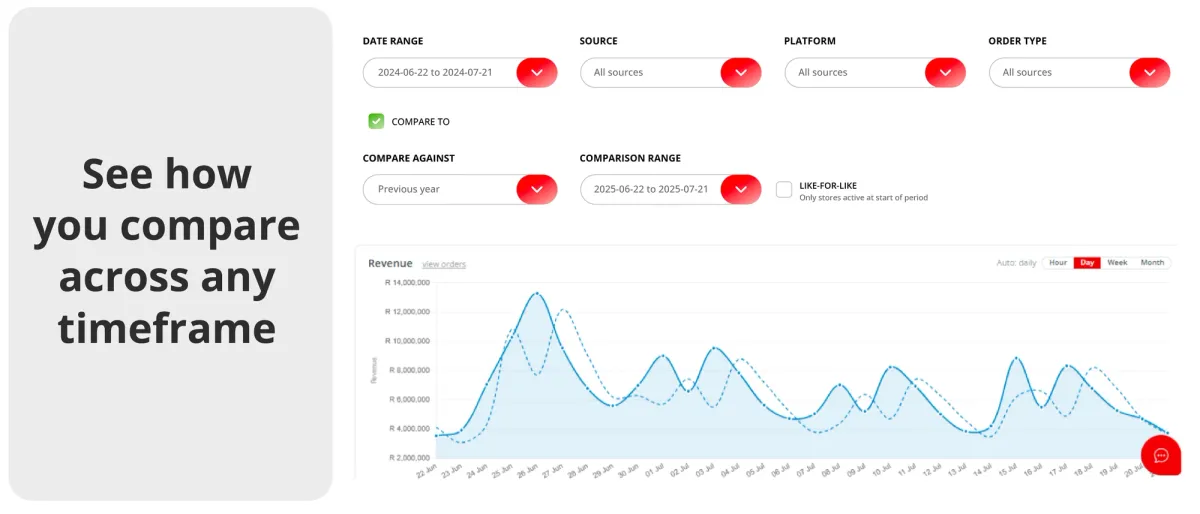
Want to know whether sales are improving? The Compare To option lets you compare your current results with another period (such as last month, last quarter or last year). It’s smooth and wrinkle free operation just the way you want it.
You can also switch on Like-for-like comparisons. This helps prevent new or closed QSRs from affecting the comparison, giving you a clearer view of actual performance.
Understand where your sales come from
The Sales Breakdown shows how your revenue is made up, including Product Sales, Delivery Fees, Driver Tips, Discounts and Net Sales. The Orders & Revenue chart adds another useful and very attractive layer. You can see when orders are happening, identify busy days and peak hours, and follow sales trends over time.
Drill down into one QSR
Sometimes you need to go beyond the overall numbers. Simply filter the dashboard to a single store and get more detailed information, including daily summaries, delivery zone performance and itemised orders. That means you can investigate questions quickly without waiting for another report from Head Office.
Where to find it
You’ll find the Sales Dashboard in YUMBI Reports, under the Sales tab on the left-hand menu.
Log in and explore your numbers today. With your sales information in one clear view, making better decisions now becomes so much easier no matter how you face the day!