










Real-Time Dashboards
Live performance data across all channels, all locations, all dayparts. No waiting for yesterday's report. See what's happening now.
 InsightsIntelligence
Insights consolidates every ordering channel, from your own StoreFront, Switchboard, Dine-In and To-Go to third-party aggregators, into real-time, role-based dashboards. With predictive analytics plus customer acquisition, conversion and lifetime value tracked at individual level, it's the single source of truth for your digital ordering operation.
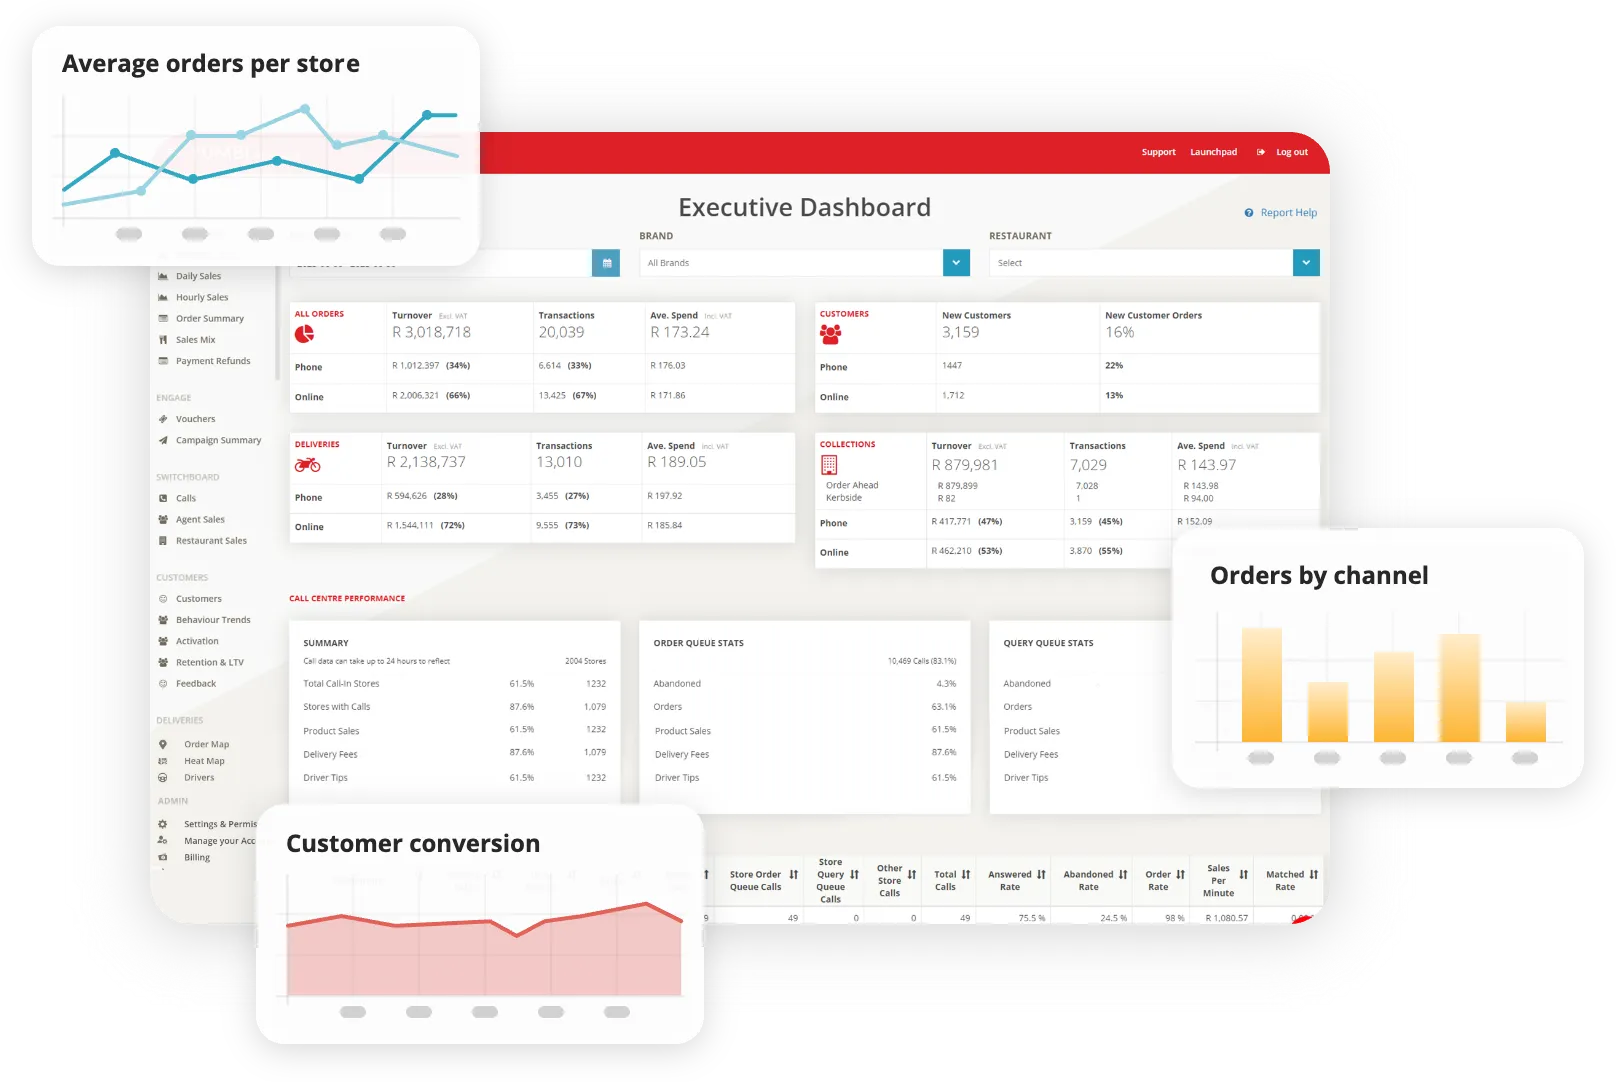
Because Insights is powered by Gateway, reporting is automatically standardised across your own channels and third-party aggregators alike. No manual reconciliation. No data gaps. One source of truth for the entire digital commerce operation.
And because Gateway captures data at the transaction level, Insights moves beyond historical reporting into predictive analytics that forecast revenue, flag performance anomalies and surface opportunities before they expire. Real-time. Role-based. Actionable.
Live performance data across all channels, all locations, all dayparts. No waiting for yesterday's report. See what's happening now.

Revenue prediction, demand forecasting, and performance anomaly detection move you from reacting to anticipating.

Track customer demand and delivery performance geographically to optimize your zones and efficiency.

Who your best customers are, what each is worth over time, and where acquisition is actually converting, tracked at individual customer level.
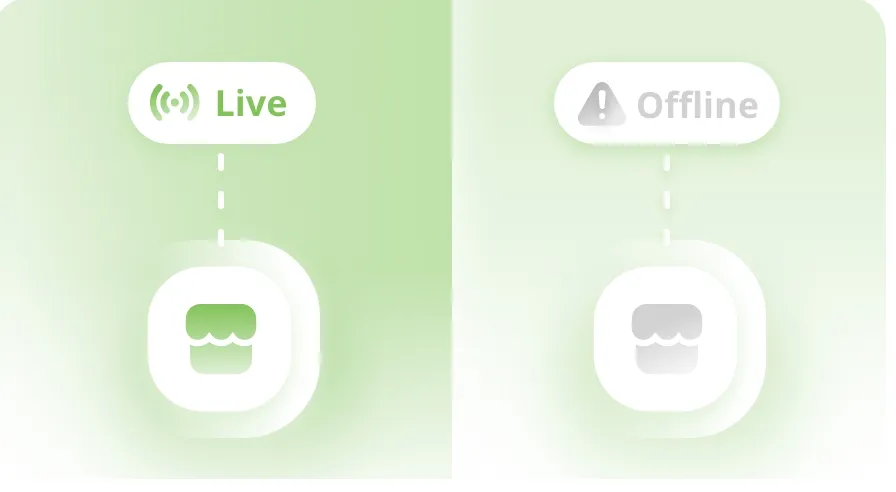
Track exactly which stores are live, when they go offline, and for how long. Catch delivery platform issues via your dashboard, not customer complaints.
Each team gets a tailored view, the same source of truth seen through a different lens. Operations sees throughput. Marketing sees attribution. Finance sees margin. No spreadsheet stitching, no waiting on a BI team.
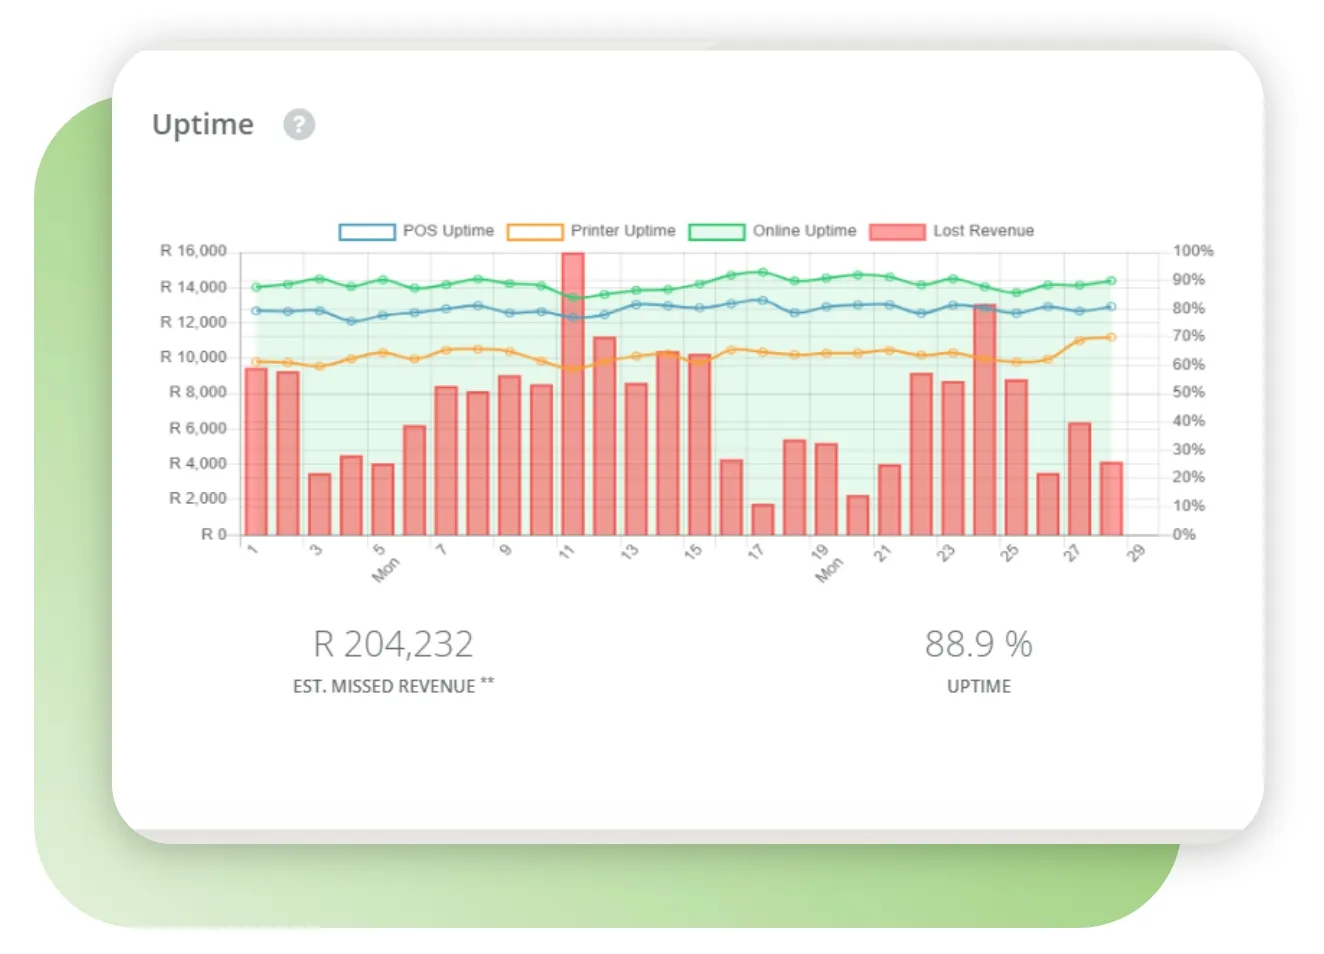
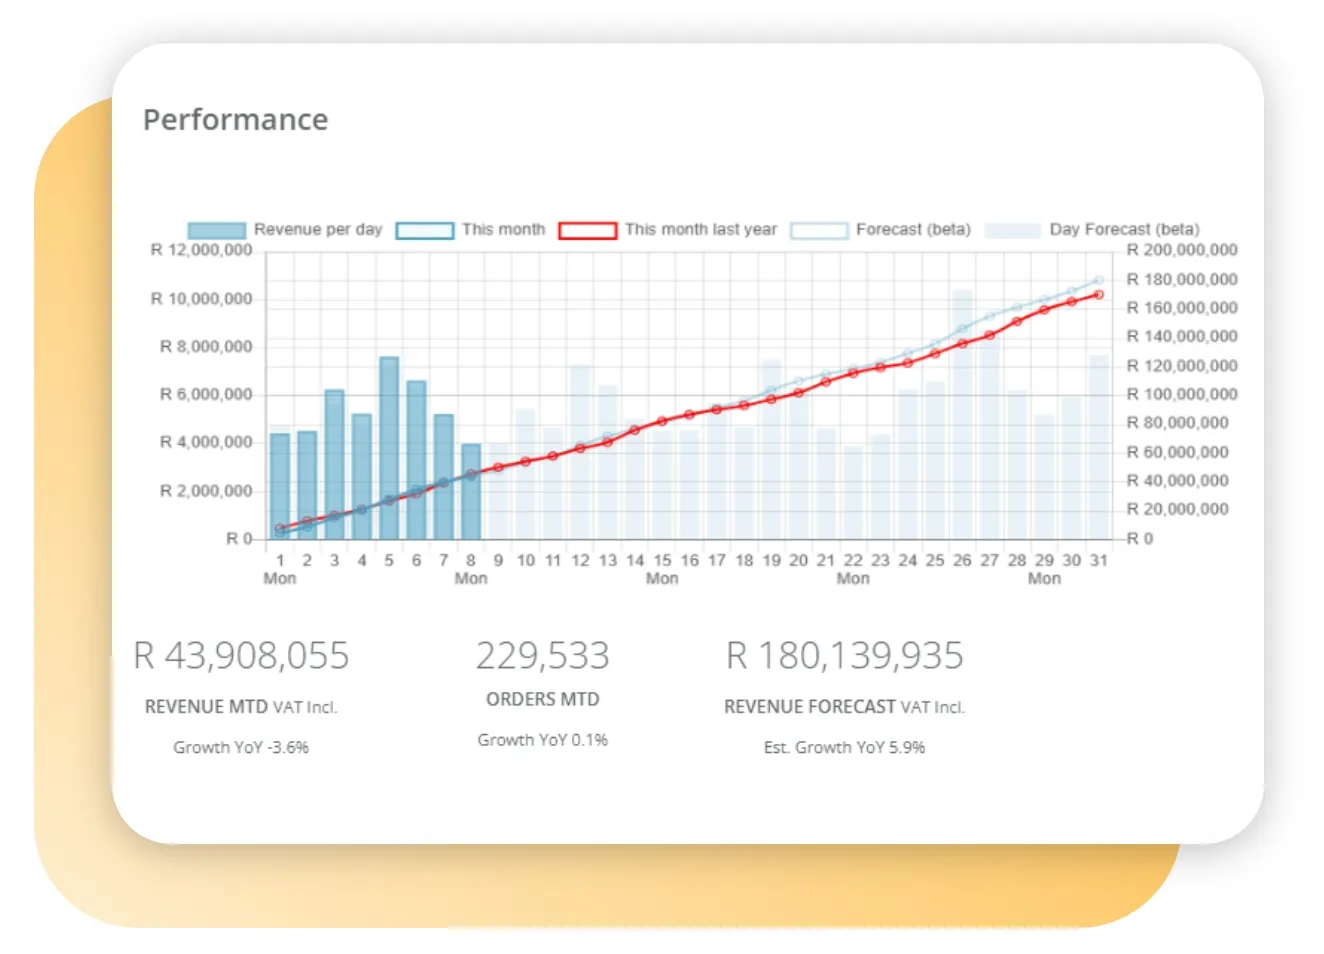
Store-by-store performance, daypart heatmaps, aggregator uptime monitoring, and delivery efficiency, all in one operational view.
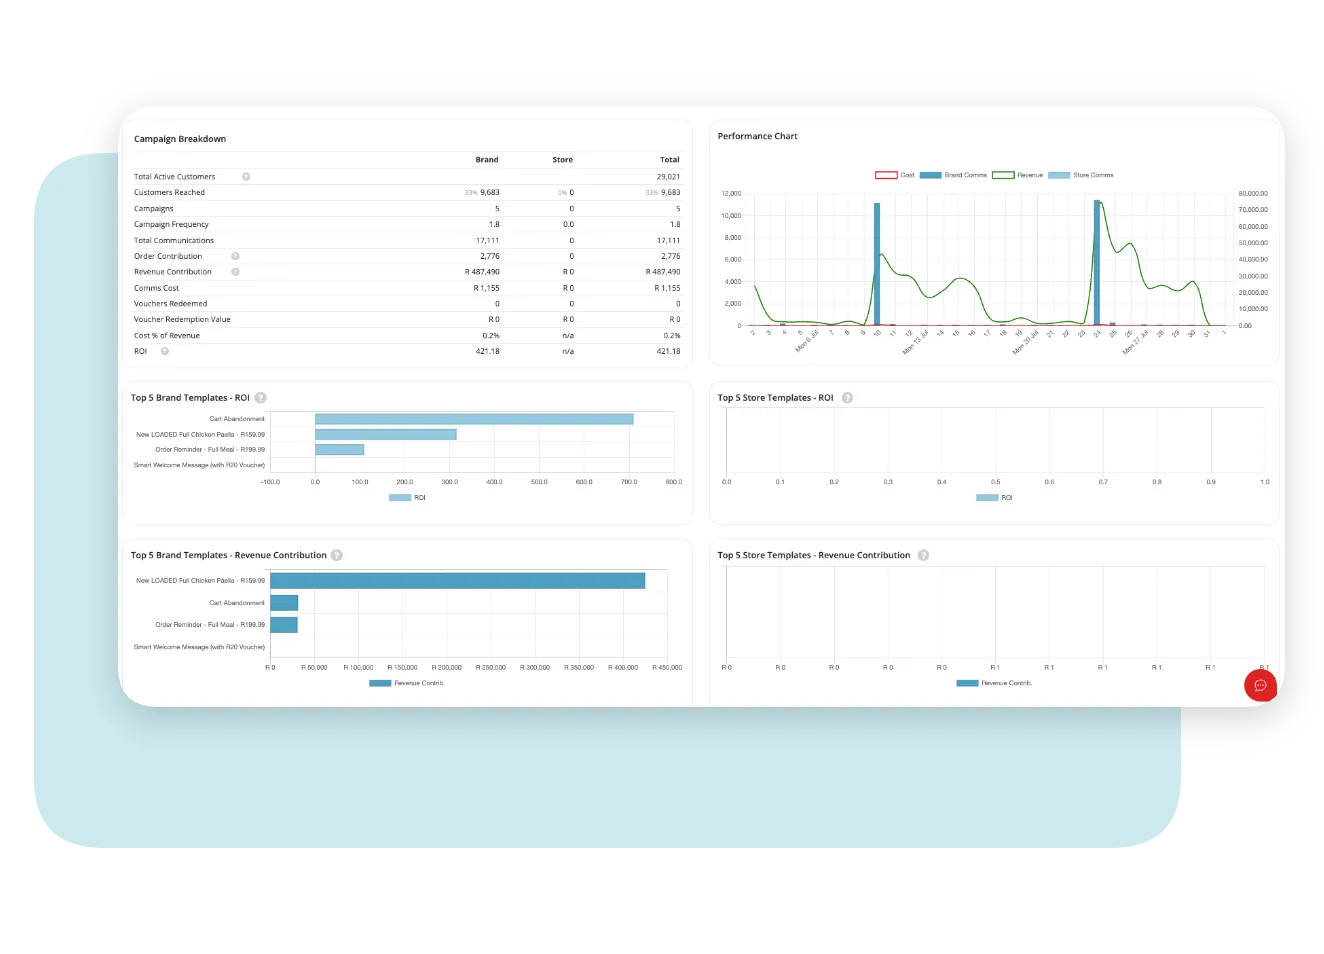
Channel attribution, voucher ROI, customer lifetime value, and campaign performance, all from the same standardised order data feeding Engage.
Brand-level rollups, customer lifetime value, predictive revenue forecasting, and the data warehouse exports your finance team can actually work with.
YUMBI's graphical insights are designed for specific roles, so teams get reports that are easy to read and highly relevant to them. Spot trends, refine campaigns, fix operational issues, and grow customer engagement, without needing a BI analyst in the room.
 Store revenue performance & orders by channelDelivery performance & store uptimeCustomer engagement communication & strategy dataCustomer database segmentation by orders placedAverage orders per store, region & brand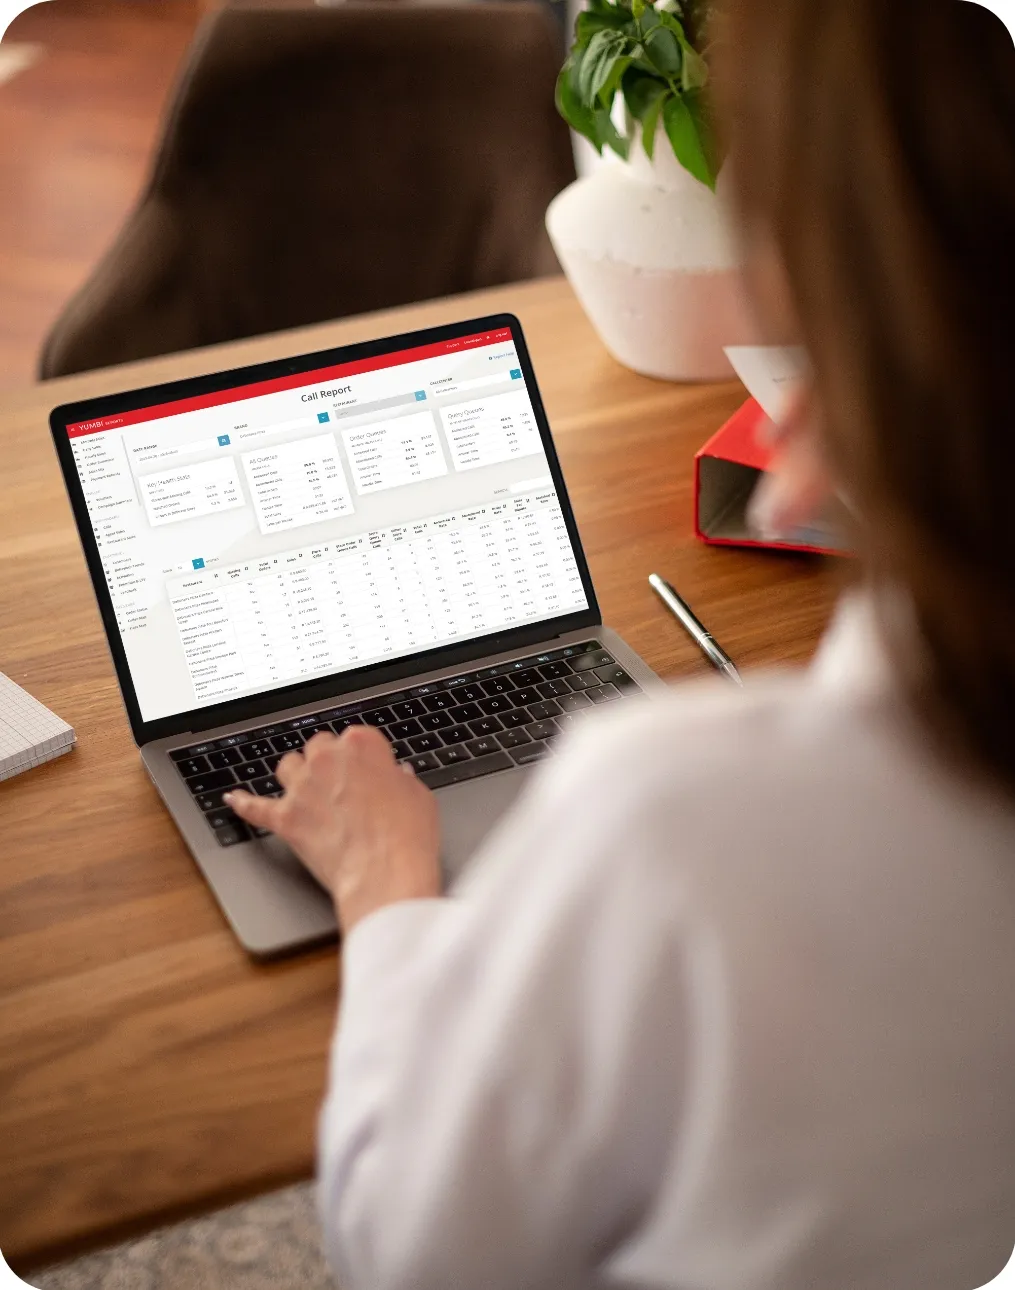
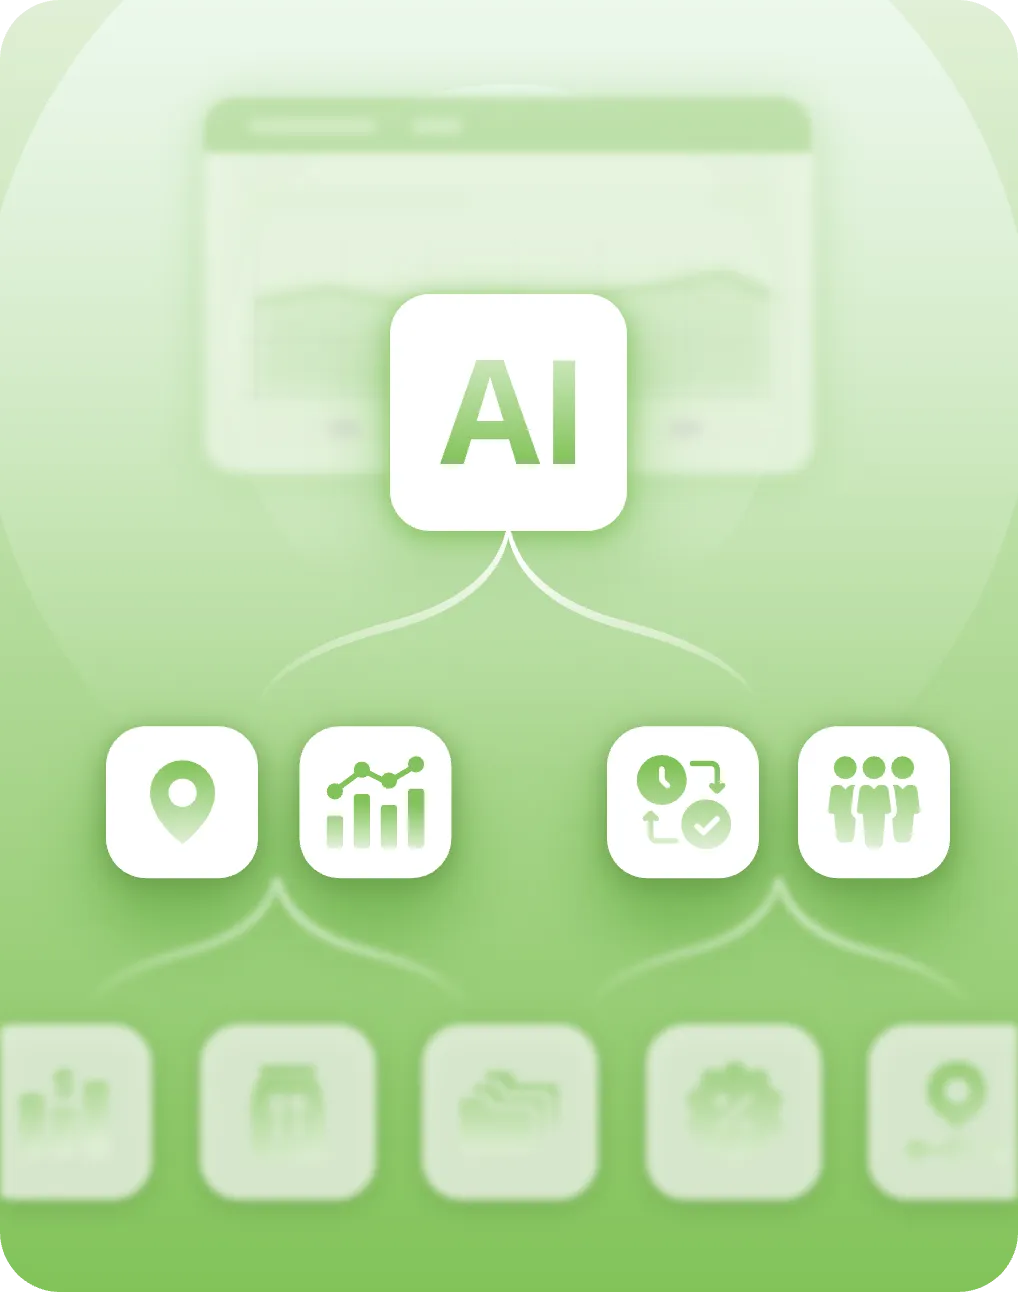
Insights leverages machine learning and AI to turn raw transaction data into forward-looking signals, so you stop reacting to last week and start preparing for next week.
Predict what customers will want, by daypart and storeForecast inventory needs and reduce wasteSchedule staff against demand, not gut feelSurface anomalies like outage, drop and surge as they happenFuture-proof against shifts in local and global trendsOwned and aggregator channels standardised under one roof. No manual reconciliation.
Dashboards update in real-time as orders flow through Gateway. Catch issues as they happen.
Operations, Marketing & Finance each see what they actually need, no spreadsheet stitching.
Insights integrates with Snowflake, so you can sync your full ordering data into your warehouse for deeper analysis, custom modelling, and group-wide BI alongside the rest of your data.
See all integrations
Insights turns raw transaction data from Gateway into actionable intelligence, and feeds it forward into Engage and BeHeard for automated response.
Insights is YUMBI's reporting and analytics platform that turns restaurant ordering data into actionable, visual reports. It provides real-time dashboards on sales performance, delivery tracking, customer behaviour, and more, all designed for specific business roles.
Store revenue performance and orders by channel, delivery performance and store uptime, customer engagement and segmentation, acquisition and conversion, individual customer value, and average orders per store, region and brand, standardised across your own channels and third-party aggregators alike.
Yes. Insights applies machine learning to transaction-level data from Gateway to predict demand by daypart and store, forecast inventory needs, schedule staff against real demand, and surface anomalies such as outages, drops and surges as they happen.
Each team gets a tailored view of the same source of truth. Operations sees throughput, Marketing sees attribution, and Finance sees margin, with no spreadsheet stitching and no waiting on a BI team.
Yes. Insights integrates with Snowflake, so you can sync your full ordering data into your own warehouse for deeper analysis, custom modelling, and group-wide BI alongside the rest of your data.
Delivery heat maps track customer demand and delivery performance geographically so you can optimise zones and efficiency, while aggregator and store uptime alerts catch platform issues on your dashboard rather than through customer complaints.
Every order already generates the data. Insights turns it into decisions.
A 30-minute operations review covering real-time dashboards, aggregator uptime, delivery performance and store-level benchmarking.
Book an operations reviewCampaign performance, voucher ROI, customer lifetime value, and channel attribution, all in one place, all measurable.
See campaign attributionPredictive revenue forecasting, customer lifetime value, and Snowflake exports, built for finance teams and BI analysts.
Request a strategic review