










Your QSR can quite easily lose sales without you even realising it. If a device goes offline, orders may stop coming through and every minute can mean another missed sale. The problem is that keeping track of connectivity across a large QSR network can be a challenging situation. Which stores are online? Which are offline? Which devices are causing problems? And, most importantly, where are the connectivity issues costing your QSR the most?
The YUMBI Connectivity Dashboard brings these answers together in one place.
See what is happening right now
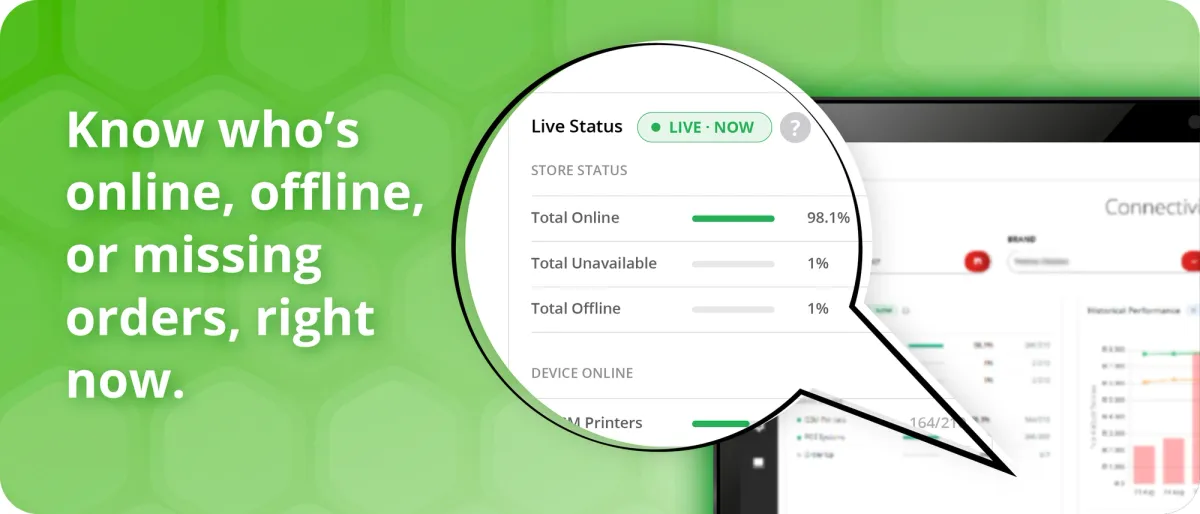
The Live Status panel gives both brand teams and you an immediate view of each store. You can see how many are Online, Unavailable or Offline at any given moment. The dashboard also breaks this down by device type, including GSM Printers, POS Systems and Order Up. This means you can quickly see where attention may be needed instead of searching through separate reports.
Track problems over time
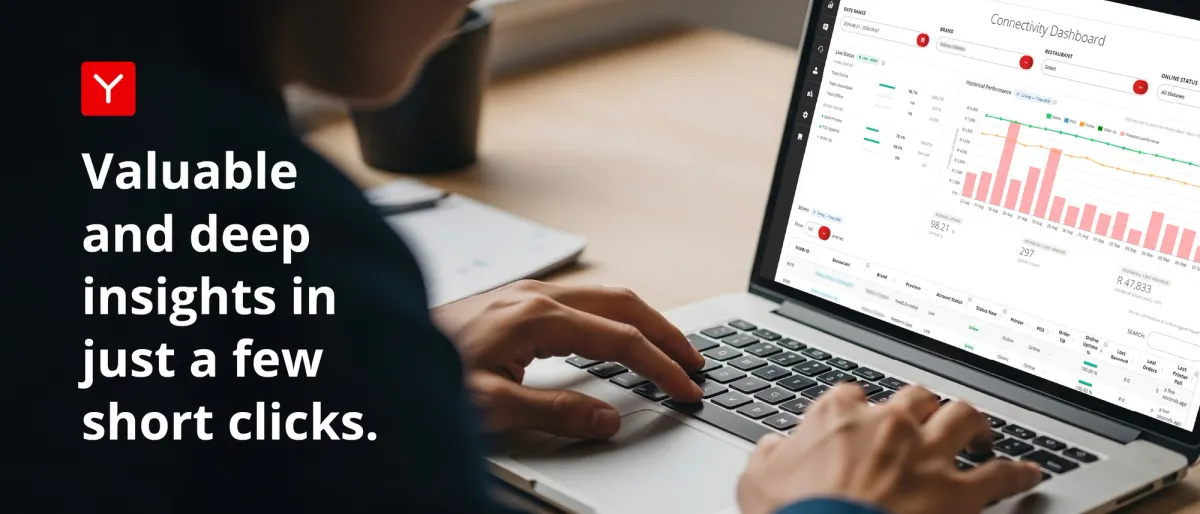
Knowing that a store is offline is extremely useful. Knowing when connectivity problems usually happen is even more useful. The Historical Performance chart shows uptime by day, along with potential lost revenue. Select a day and you can drill down to an hour-by-hour view. This helps answer important questions. Are problems happening during busy trading periods? Is a particular day worse than others? Are connectivity issues becoming more frequent?
Find your biggest problem stores
The Stores table puts the information you need to act in one place. For each store, you can see uptime percentage, lost revenue and lost orders.
The table is sorted so that the stores potentially costing you the most revenue appear first. Rows are also colour-coded, making offline and unavailable stores easier to identify. That means your team can prioritise the stores where action could have the biggest impact.
Turn connectivity data into action
The Connectivity Dashboard is not just about monitoring devices. It helps your team understand where connectivity problems may be affecting sales. A quick check can help you spot issues early, identify the stores that need attention and understand the potential cost of downtime. Because when your devices are connected, your QSRs are better positioned and prepared to keep taking orders.
Where to find the dashboard
The Connectivity Dashboard is available in YUMBI Reports, under the Operations tab, called Connectivity. Log in and take a look. A few minutes spent checking your network could help you identify problems before they turn into lost sales!